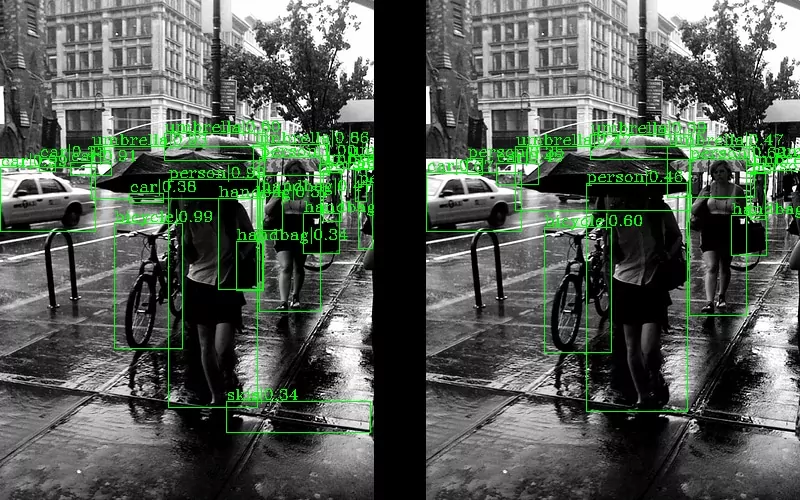
Convolutional Neural Networks (CNNs) constitute an extremely powerful class of machine learning algorithms. They achieve state-of-the-art performance in most computer vision tasks, such as image classification, object detection or image generation.
However, normally we know very little about how CNN’s learn and what features they use to make predictions due to their black-box nature. Whereas having an insight into neural networks’ decision-making process is crucial not only for creating better-performing models, but also ensuring models’ fairness and accountability when they are applied to real-life problems.
A bit cliche, but rather illustrative example here is a self-driving car that goes wrong and hits a pedestrian. On one hand, without understanding the reason behind that decision, we’re unable to identify and fix the problem. On the other hand, you’ll hardly find someone willing to use such a car without explaining how the algorithm initially worked and what makes the next version safer.
Visualizing CNN’s’ decision-making process is in the ongoing research stage. At the moment, there are several techniques proposed to increase interpretability and understand how neural networks make their decisions. One of them is Class Activation Maps (CAMs) [1] that I want to talk about in more detail in this blog post.
Class Activation Maps (CAMs): how they work?
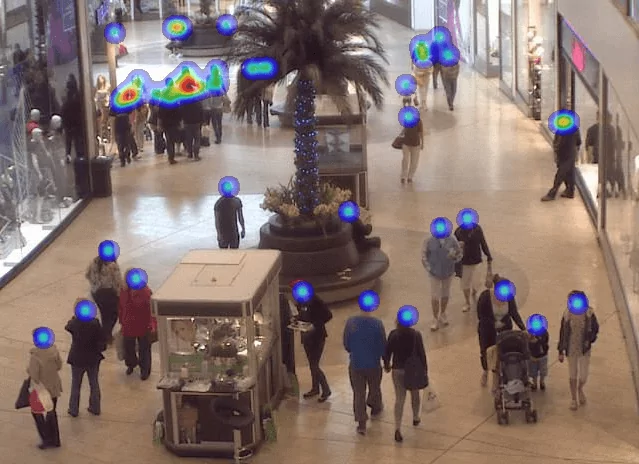
CAMs help to visualize what areas of an input image contribute to CNN’s final prediction. This becomes possible through producing a heatmap that highlights pixels in the input image that influence the assignment of this image to a certain class.
For CAMs to work, we need the classification network to be trained with a Global Average Pooling (GAP) layer injected between the last convolutional layer and the final fully connected layer. The GAP layer reduces each feature map to a single number by taking the average of all its values.
As a result, each node in the GAP layer corresponds to one feature map. Furthermore, weights connecting the GAP layer with the final layer encode the contribution of each map to the prediction (how important a certain feature map is).
To obtain the heatmap for a certain class, we multiply feature maps with the corresponding weights and sum them up. You can see the process of generating CAMs at the graph below.
 1")
CAMs are a very powerful tool for visualization of the neural network’s decision-making process. However, they have certain limitations:
1) we can apply CAMs only if the CNN contains a GAP layer,
2) heatmaps can be generated only for the last convolutional layer.
To address these issues Gradient Weighted Class Activation Mapping (Grad-CAM) [2] was proposed.
 2")
Gradient Weighted Class Activation Mapping (Grad-CAM)
Grad-CAM is a generalization of CAM, which can be applied to any type of CNN. Additionally, heatmaps for every layer can be generated (not only for the last one).
The difference between CAMs and Grad-CAMs is the way in which weights for each of the feature maps are calculated. Precisely, for the Grad-CAM the gradients of the score for a certain class with respect to feature maps of a convolutional layer are computed.
Next, these gradients are global average pooled to obtain the neuron weights. As a result, similar to CAMs, the computed weights encode the importance of feature maps for a target class.
By multiplying feature maps with their weights, summing them up and applying ReLU function to the result we obtain localization maps, where important regions of the input image are highlighted.
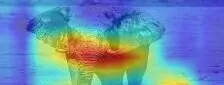
Below activation maps for two classes, namely gazelle and elephant, are presented.
 3")
CAMs are a great tool for explaining CNN’s decisions. As can be seen above, they highlight pixels in the input image, that were relevant to the prediction. This helps us understand what CNN takes into account during the decision-making process and create more robust models.
* * *
I hope you find this blog post useful. Also, stay tuned to read the second part of this article, where I’ll focus on a different technique for explaining neural networks’ decisions: layer-wise relevance propagation (LRP).
To learn more about our R&D projects.
References
[1] Zhou, Bolei, et al. “Learning deep features for discriminative localization.” Proceedings of the IEEE conference on computer vision and pattern recognition. 2016.
[2] Selvaraju, Ramprasaath R., et al. “Grad-cam: Visual explanations from deep networks via gradient-based localization.” Proceedings of the IEEE International Conference on Computer Vision. 2017.