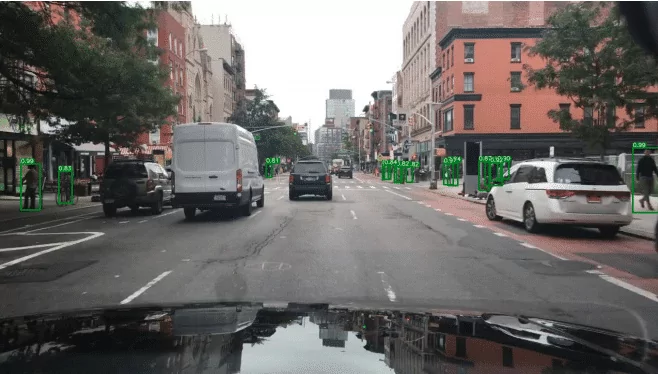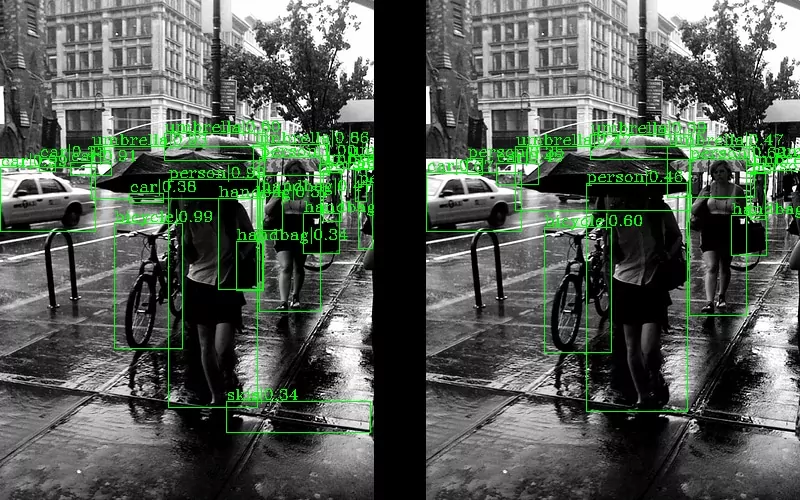
Deep learning (DL) algorithms are able to draw some conclusions by analyzing given data with or without provided annotations (for example in the form of labels). In the case of computer vision, the data is supposed to be a big pile of images, while the way they should be labeled depends on the problem to be solved. In this post, we will do a quick but broad in scope review of the database created during our studies, namely AGAR dataset, which stands for Annotated Germs for Automated Recognition database [1].
Why AGAR?
One of the challenges of modern microbiology is the automation of the process of recognizing species of microbes grown on an agar plate. Nowadays, the classification is done by analyzing specific morphological features such as shape, color, texture or size of microbial colonies grown on agar medium. This task requires specialist knowledge and often a lot of experience, as some microbes show similar characteristics. Moreover, the colonies of one species may vary in appearance depending on the time of breeding, growth medium or availability of nutrients. In recent years, the role of a specialist is increasingly being replaced by automatic image analysis. However, this is not easy as the dissimilarity between the different species of bacteria can be very subtle.
Preparing our own set of samples with photos of microbes was necessary because such a big and varied dataset did not exist in the publicly available collection. Although many researchers [2-5] have been concerned with the classification and counting of microorganisms, the number of provided images is definitely too small to optimize the parameters of the complicated neural network, such as object detector. In addition, mainly microscopic photos [2] or only small segments of agar plate culture [3-5] were made available.

It all starts with data
To enable an effective learning process of neural networks, it is important to have a similar number of samples for each type of microbes, as diverse as possible. Additionally, in case of supervised learning, all samples must be properly classified and described. For that purpose, an AGAR dataset is introduced.

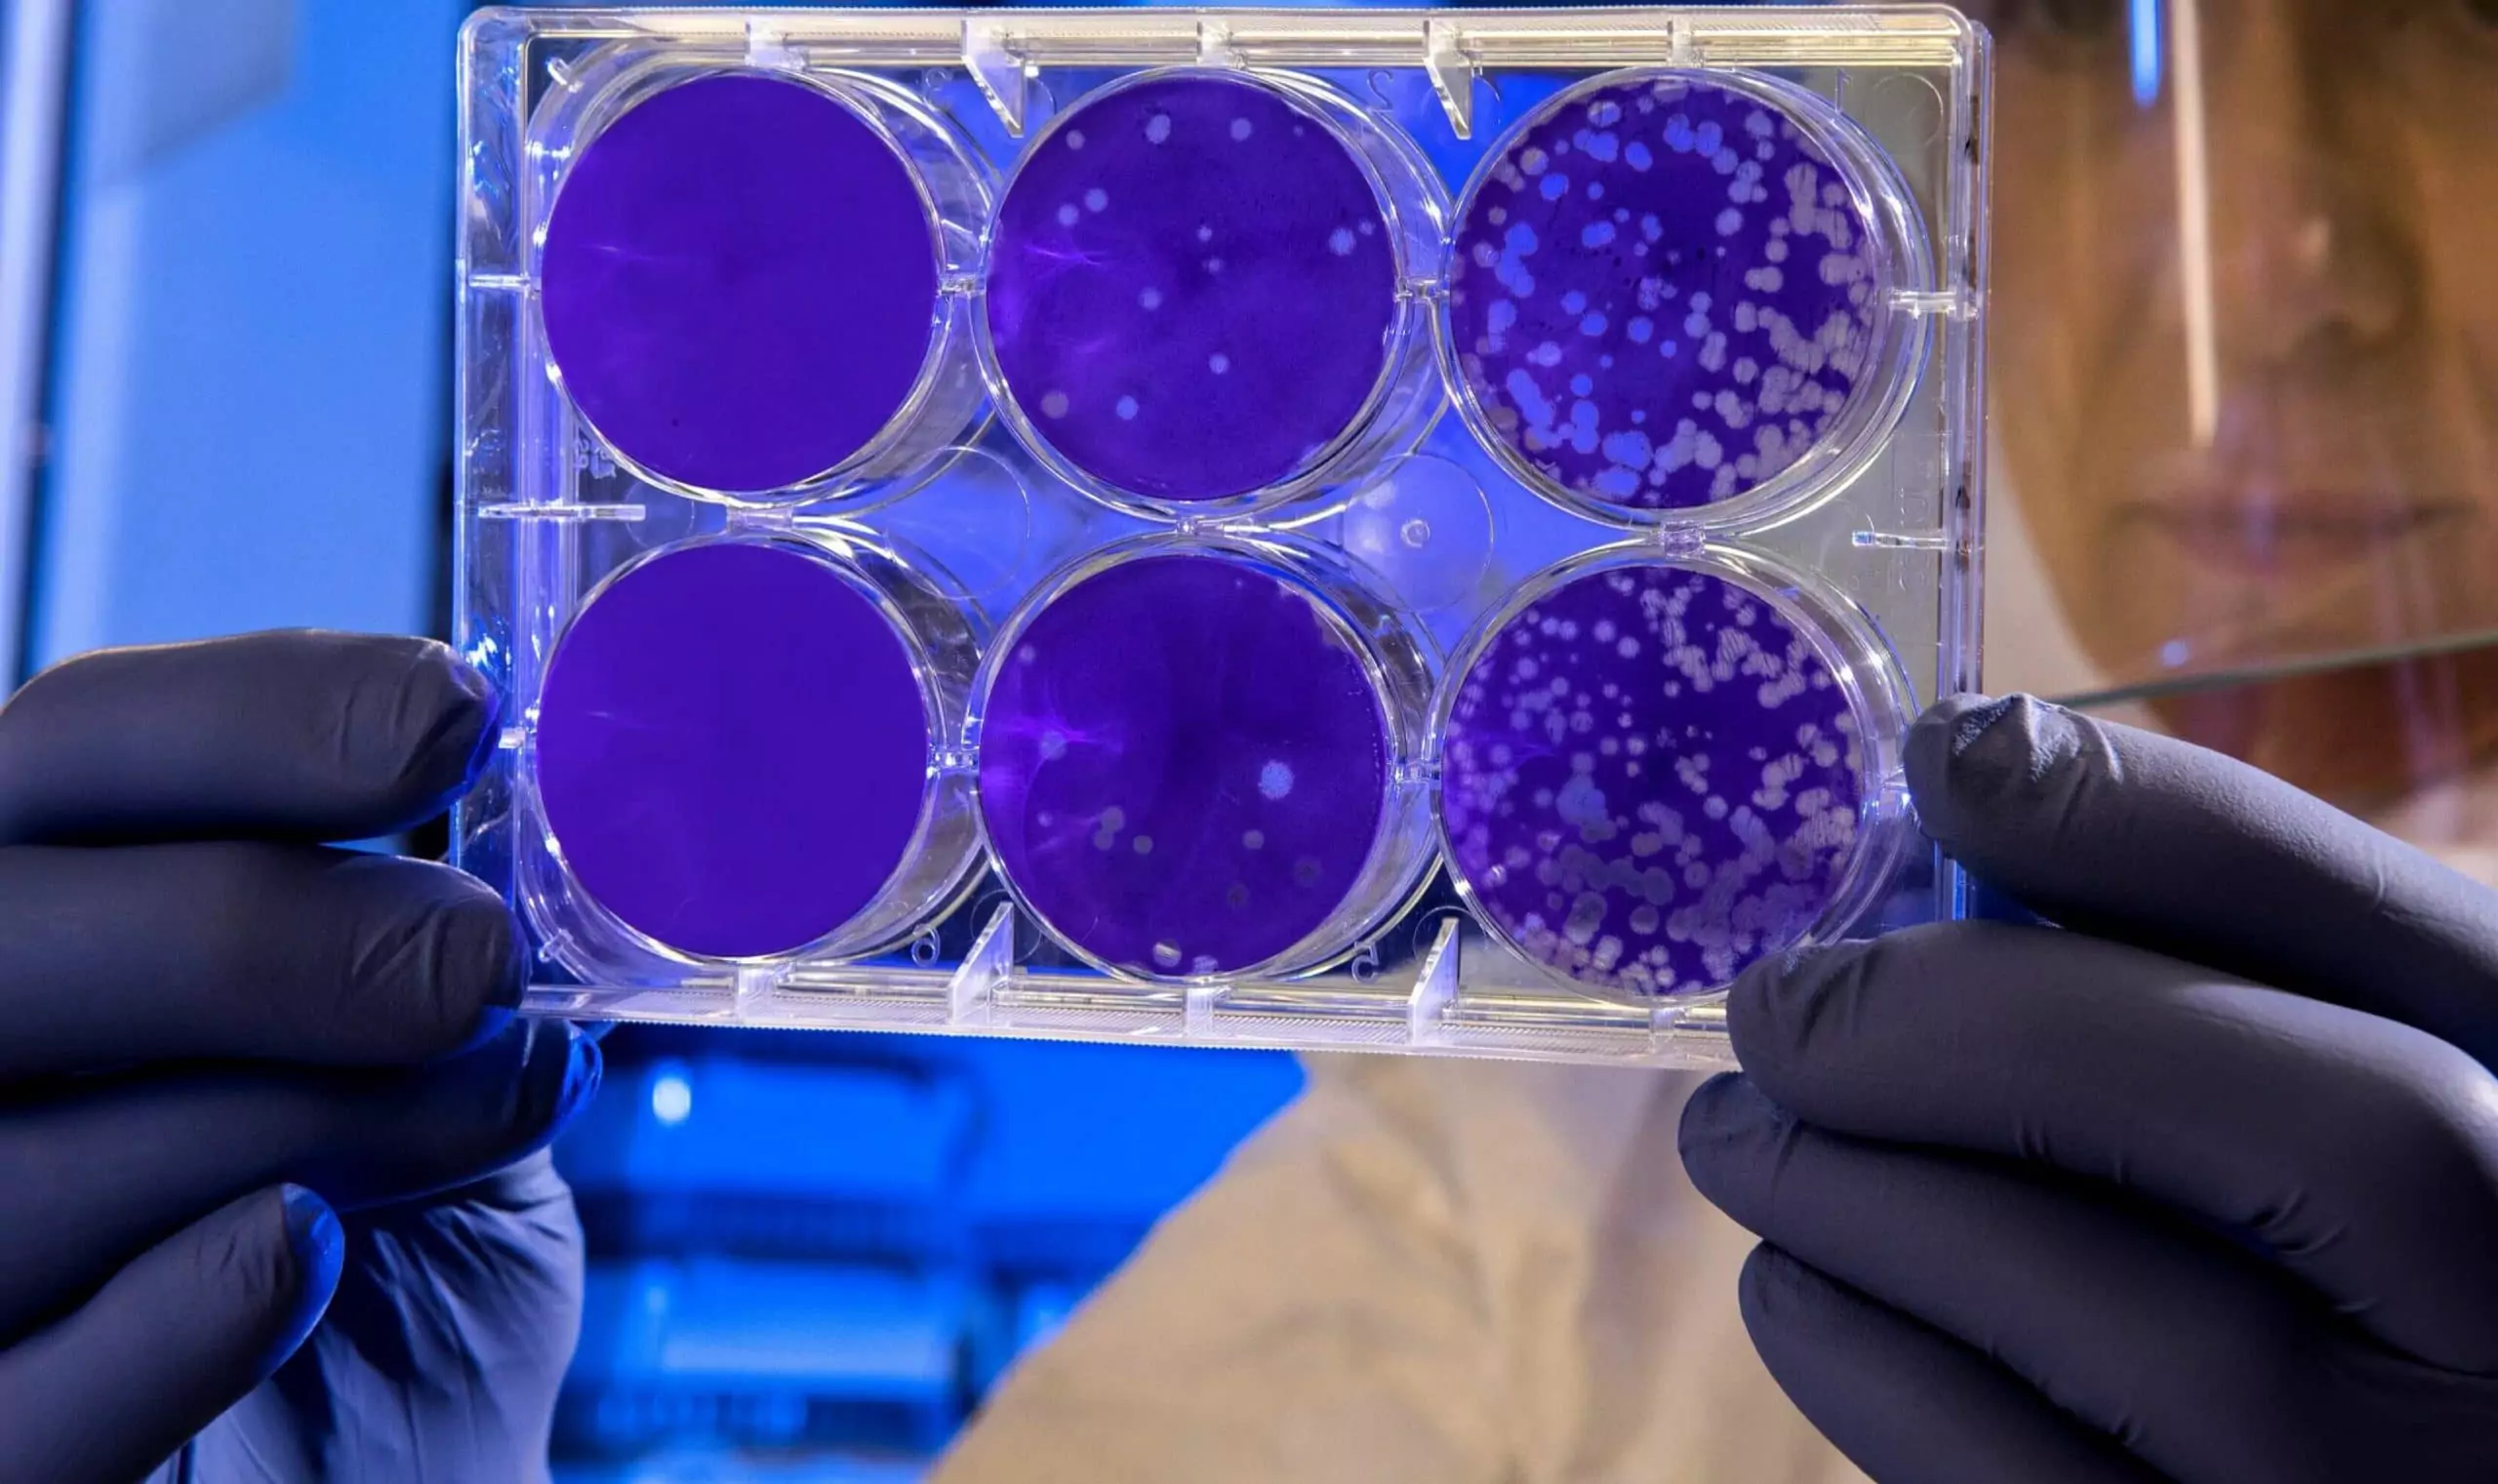
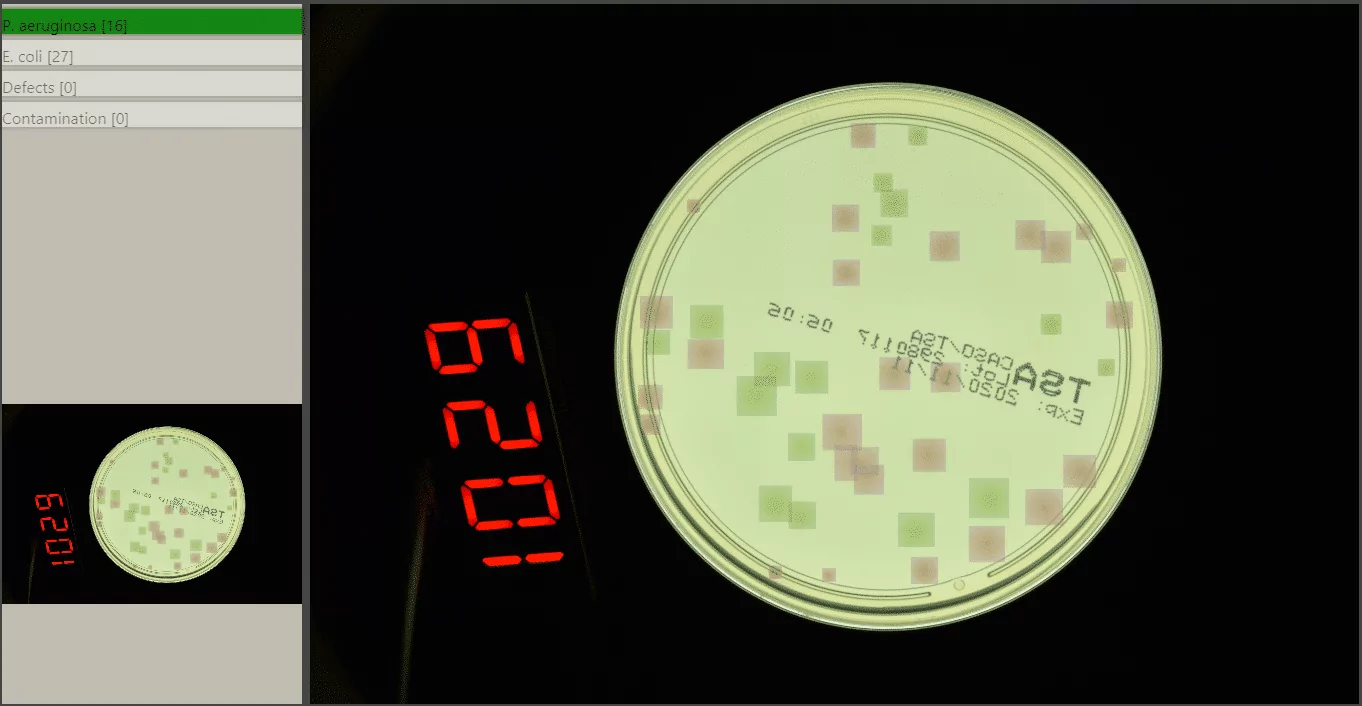
The AGAR is an image dataset for microorganism colonies detection and counting. This set contains 18k photos of Peri dishes taken by two cameras, under diverse lighting conditions, from very bright images to even more vague. We distinguish 4 acquisition setups as provided in Figure 2. The images are manually labeled by professional microbiologists using a bounding box and class tag to train and evaluate object detection algorithms. It contains in total 336 442 annotated colonies of five microorganisms (Staphylococcus aureus, Bacillus subtilis, Pseudomonas aeruginosa, Escherichia coli, and Candida albicans) most commonly used according to the Pharmacopoeia guidelines [6]. In addition, some defects (i.e. marks on agar surface) and contaminations (any unwanted microbiological contamination) were also labeled. AGAR database is not only photos of Petri dishes covered with countable (more than zero and less than 300 colonies) numbers of microbial colonies. The database also includes empty, and uncountable samples.
For plates with colonies number higher than 50, but less than 300, it is still possible to count by human, but colonies tend to agglomerate and are hard to distinguish from each other. The number of colonies higher than 300 was treated as uncountable — too high a number leads to counting errors due to overcrowding across the surface of the plate.

Exploratory data analysis
AGAR database contains several thousand samples for each type of bacteria, which additionally can be further extended by standard transformations such as rotation or mirroring. Exact knowledge of the distribution of instances for each microbial class might be helpful during the training and evaluation of the DL-based system. Sometimes it happens that misclassification or other errors are caused by the imbalance in the dataset or some misleading labels. Let’s try to extract from the AGAR dataset as much information as we could.
Especially the size of the bounding boxes is essential — it is a well-known fact that even the state-of-the-art detectors do not work well with small objects.

A summary for our datasets showing the proportion of images grouped by background category is shown in Figure 4. Different shades for subgroups in the given background category indicates samples classified by experts as empty, countable, and uncountable. At the very beginning of the data collection process, we collected photos obtained with a higher resolution camera (bright + dark + vague, see Fig. 2). In this part we have chosen a low level of dilution to significantly reduce the number of empty samples, and therefore uncountable probes account for more than 33% of this part of our collection.
The number of instances per analyzed category is illustrated in Figure 5. AGAR dataset for combined bright and dark subgroups achieves a good balance in the number of instances of different microbe species, which is significantly helpful for learning a robust detector. It is a bit poorer in the case of a vague subgroup because two microbe classes are missing. Additionally, for this part of dataset, more than 80% of photos contain two different microorganisms, in contrast to the rest of the collection, where such images account for 15% (in case of photos from bright and dark subgroups) and 40% (in case of lower-resolution) of the total images of the subgroup. For the lower-resolution subgroup, there are clearly fewer instances for B.subtilis class. The most numerous microbe category is E.coli, and the least numerous group is B.subtilis.

In case of the size variability of annotations per category for the whole dataset, we distinguished two bounding box size distributions: 0 – 128 px for C. albicans and S. aureus, and 16 – 512 px for P. aeruginosa, B.subtilis, and E. coli. In total (excluding defects and contamination), there are 154 630 bounding boxes with square root of area below 128px, 180 173 within 128 – 512px, and 1 639 above 512px. This wide range of sizes makes the detection task more challenging because models have to be flexible enough to handle the variety of instances’ dimensions.

Sum up
Nowadays, convolutional neural networks (CNN) are very successful in problems related to pattern recognition in images. The first attempts to use CNN in microbiology appear, however, they are not exhaustive. The creation of the huge and well-balanced AGAR database enables the design of a deep neural network for the detection and counting of microbial colonies grown on an agar substrate. Our main motivation was to prepare a universal model that can be successfully used in the analysis of various microbiological samples. The deep learning studies and their results will be described in our next post.
If you are interested in the full AGAR dataset for your research, you can find it on a dedicated page.
References
[1] Sylwia Majchrowska, Jarosław Pawłowski, Grzegorz Guła, Tomasz Bonus, Agata Hanas, Adam Loch, Agnieszka Pawlak, Justyna Roszkowiak, Tomasz Golan, and Zuzanna Drulis-Kawa. AGAR a Microbial Colony Dataset for Deep Learning Detection, 07 July 2021, PREPRINT (Version 1) available at Research Square [https://doi.org/10.21203/rs.3.rs-668667/v1]
[2] Bartosz Zielinski, Anna Plichta, Krzysztof Misztal, Przemysław Spurek, Monika Brzychczy-Włoch, and Dorota Ochonska. Deep learning approach to bacterial colony classification. PloS One, 12(9), 2017.
[3] Alessandro Ferrari, and Alberto Signoroni. Multistage classification for bacterial colonies recognition on solid agar images. In 2014 IEEE International Conference on Imaging Systems and Techniques (IST) Proceedings, pages 101–106, 2014.
[4] Alessandro Ferrari, Stefano Lombardi, and Alberto Signoroni. Bacterial colony counting with convolutional neural networks in digital microbiology imaging. Pattern Recognition, 61:629 – 640, 2017.
[5] Mattia Savardi, Alessandro Ferrari, and Alberto Signoroni. Automatic hemolysis identification on aligned dual-lighting images of cultured blood agar plates. Computer Methods and Programs in Biomedicine, 156:13 – 24, 2018.
[6] European Pharmacopoeia, chapter 2.6.1 Sterility, page 155–158. Council of Europe, 6 edition, Ph. Eur. 6.0,01/2008:20601, 2007.
Project co-financed from European Union funds under the European Regional Development Funds as part of the Smart Growth Operational Programme.
Project implemented as part of the National Centre for Research and Development: Fast Track.