Object detection is one of the fundamental tasks in computer vision and it has been widely studied in the past decades. The goal behind it is simple – to recognize various objects in images or videos. But how exactly can this be achieved?
In our previous post, we described a method of counting objects based on density map estimation. In the conducted studies, the object counting method in images uses data with point-like annotation, which is easier and cheaper than bounding boxes around all objects which exist in an image. Original architectures for this type of object counting are used to generate a counting number for only one kind of object. Obviously, by increasing the number of filters, we can get more output values, and then recognize multiple types of objects in each image. The question is: Does it make sense? Since we have a bounding box around each object, we may use object detection techniques to solve object counting problems.
Currently, state-of-the-art solutions are based on deep learning. Specifically, a neural network is trained to locate an object in an image and assign it to the proper class, e.g. person, car or dog. In today’s post we will present some popular methods to solve object detection tasks using deep neural networks.
Prerequisite knowledge for object detection task
Detecting objects in images has a lot of real world applications. For example, pedestrian and vehicle detection in video surveillance systems [1], logo detection in e-commerce systems [2], or car damage detection for insurance companies [3] (sample predictions are shown in Fig. 1.). Usually, each real-world scenario has its own unique properties. Thus, carefully-designed detection algorithms are required. On the other hand, we also need to have consistent criteria to verify the usability of various algorithms. Here, defined evaluation metrics and some widely used datasets for each task come in handy. Common metric for all tasks to perform detection accuracy is mean Average Precision (mAP).

To calculate mAP, we first need to understand Intersection over Union (IoU) score. The IoU is given by the ratio of the intersection area and the union area of the predicted bounding box and the ground truth bounding box. For bigger IoU, bounding boxes overlap more, so detection is better. In Fig 2., bounding boxes with different IoU values are presented. We need to set the IoU threshold, usually 0.5. If IoU is bigger than the threshold, we are assured that bounding boxes point to the same object. In the case when IoU is below a predefined threshold, we treat the predicted bounding box as a False Positive (FP) result. Similarly, for bounding boxes for which the IoU is greater than the threshold, we have True Positive (TP) cases. On the other hand, when the object detector did not detect an object, then it would be considered as a False Negative (FN) case. Armed with this knowledge, we can mathematically define two concepts – recall and precision as

where TP, FP, FN are the number of above-mentioned cases. Precision measures how accurate a model’s predictions are, while recall indicates how good a detector is at finding all the positives.

Finally, Average Precision (AP) for a given class is computed as the weighted mean of precisions achieved at multiple IoU thresholds, with the increase in recall from the previous threshold used as the weight. This score corresponds to the area under the precision-recall curve. Typically, AP@ [0.50:0.95] is used [4], which corresponds to the average AP for IoU threshold from 0.5 to 0.95 with a step size of 0.05. mAP is the average of AP over all the possible classes.
The main components of an object detector
The heart of the detector is its backbone. Nowadays, most object detectors adopt convolutional weights from models pre-trained on large scale image classification problems, which enhance detection performance. This part of the network is used as a feature extractor, which gives a feature map representation of the input. In our experiments we used ResNeXt [5] and High-Resolution Network (HRNet) [6], which are widely used architectures and rank high on the COCO detection leaderboard [4, 7]. The network’s head, which is responsible for giving proper output, is attached to the backbone.
In the case of object detection, we are dealing with two types of predictions – object localization (output in form of bounding boxes and their probability) and classification (output as classification confidences). This leads us to the major distinction between detectors: one-stage and two-stage models. Two-stage detectors are based on region proposal generation in the first stage, and then in the second stage regions are filtered and assigned to the most likely class. For one-stage models, a single neural network is designed to directly predict classes and bounding box locations. One-stage detectors are much faster, but have relatively worse performance, while in two-stage cases researchers often reported state-of-the-art results on many public benchmark datasets. Fig. 3. shows models with the highest mAP score on COCO dataset [4] developed in the following years.

In our considerations, we apply HRNet in Cascade R-CNN [8] as the representative algorithm for two-stage detectors, and ResNeXt-101 as the backbone architecture in Fully Convolutional One-Stage Object Detector (FCOS) [9] – the main representative of one-stage models.

A closer look at chosen architectures
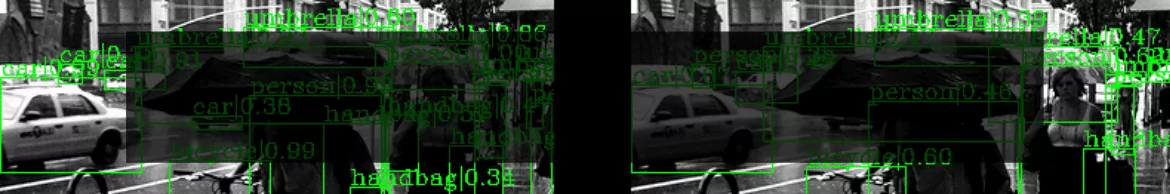
As stated above, Cascade R-CNN network [8] is a two-stage model. In the first stage the Region Proposal Network (RPN) runs a binary classifier on a set of predefined boxes (called anchors) over the image and returns a probability with which given boxes surround the objects. At this stage, the RPN predicts the possibility of an anchor being background or object. Anchors are predefined boxes with various sizes defined to capture the scale of a specific object (their size typically based on object sizes in the train subset). Anchors often do not fit tightly to objects, so RPN also performs regression to shift and resize the boxes. Nonoverlapping (in terms of predefined IoU) boxes with the probability above some set threshold pass to the second stage of the detector. It is worthwhile to mention that the main limitation of the proposal-based models is the fact that the final number of predictions is limited by the number of proposals. In the second stage, each proposal (cropped region) is assigned to the most probable object class. Fig. 4. shows a set of object bounding box proposals produced with Cascade R-CNN model for both stages.

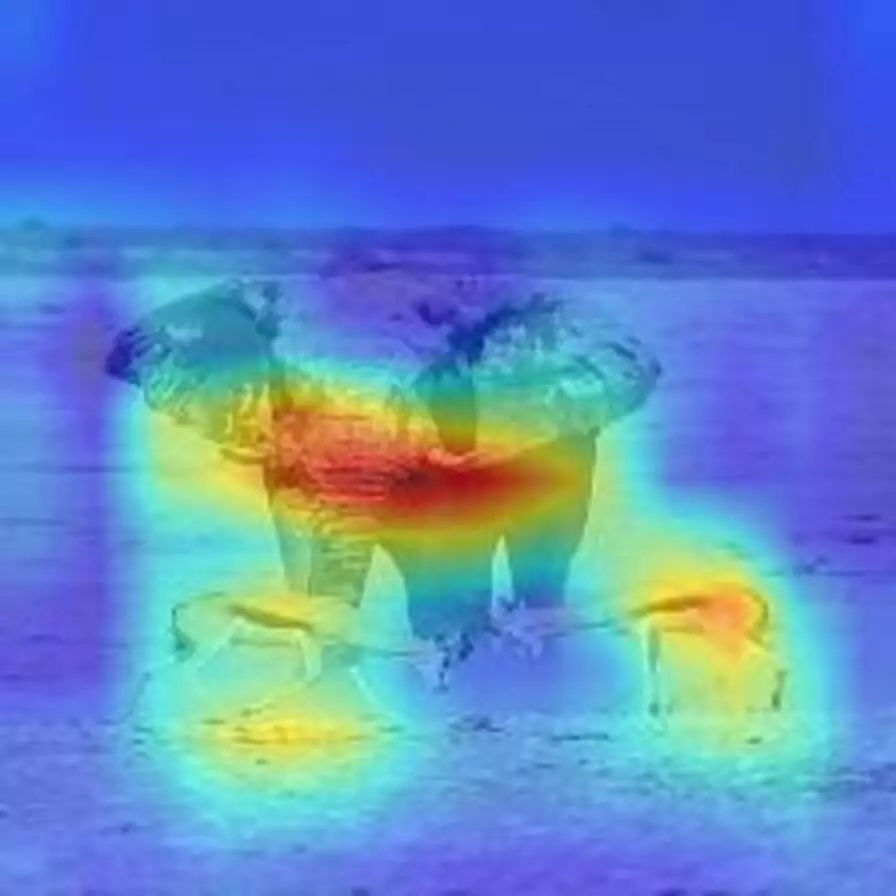
On the other hand, FCOS [9] performs per-pixel prediction (just like segmentation) in a one stage fashion. It is an anchor-free model, which means that it does not require a predefined set of anchors. The lack of anchors reduces the computational complexity and the number of predefined hyperparameters. This model is also center-based – it uses the center points or regions of objects to define pixels belonging to the detected object. To evaluate dimensions of the bounding box, the model performs regression on four distances from the center to the object boundary. This way, it determines several hundred most likely (based on predefined probability threshold) bounding boxes and classifies them. At the end, some overlapping boxes (for predefined IoU and with lower probability) are removed. Some final predictions made by FCOS network are presented in Fig. 5.

Results
We perform the evaluation on the described models on the COCO validation subset. The subset contains 80 classes of common objects, like a suitcase, a bicycle, a person, and even a zebra and a donut. In our studies, the maximum number of objects per one image is 63, while the minimum equals 0. As stated above, we tested two models, namely Cascade R-CNN [9] with HRNet backbone and FCOS [10] with ResNeXt-101. We adapted the code from mmdetection framework.

In the table below, the summary of our results is presented for both models. Visualization of achieved predictions on sample image is presented in Fig. 6. The one stage detector prepares faster inference. On the other hand, the predictions of the Cascade R-CNN model are more reliable and accurate. We used the same definition for the mean absolute error (MAE) as in our previous post. To calculate this metric, we set the value for the probability threshold at 0.5.
| Framework | Backbone | Testing time / img | mAP (%) | MAE |
| Cascade R-CNN | HRNetV2p-W40 | 275 ms | 43.8 | 2.04 |
| FCOS | X-101-64x4d | 264 ms | 42.5 | 5.34 |
Conclusion
Object detection is still an active research area. Although the market is dominated by two- or single-stage detectors in this battle of speed and accuracy, there is still plenty of room for improvements. Facebook AI research group recently released the Detection Transformers (DETR) [10] network, in which Transformers are integrated in the detection pipeline. There are also other object detection training strategies, which can be related to getting training and test data drawn from different domains (for example scenes with different illumination conditions) or the existence of only a few instance-level annotations for some classes. However, we will discuss this topic in future posts.
Literature
[1] Yang, Zhiheng, et al. “Real-time Pedestrian and Vehicle Detection for Autonomous Driving.” IEEE Intelligent Vehicles Symposium IV (2018)
[2] Hoi, Steven C.H., et al. “Logo-net: Large-scale deep logo detection and brand recognition with deep region-based convolutional networks.” arXiv preprint arXiv:1511.02462 (2015)
[3] Li, Pei, et al. “Anti-fraud System for Car Insurance Claim Based on Visual Evidence.”, CoRR in: arXiv preprint arXiv:1804.11207 (2018)
[4] Lin, T.-Y. , et al. “Microsoft COCO: Common objects in context.” ECCV (2014)
[5] Xie, Saining, et al. “Aggregated Residual Transformations for Deep Neural Networks.” CVPR (2016)
[6] Sun, Ke, et al. “High-Resolution Representations for Labeling Pixels and Regions.” CoRR in: arXiv preprint arXiv:1904.04514v1 (2019)
[7] https://paperswithcode.com/sota/object-detection-on-coco
[8] Z. Cai, et al. “Cascade R-CNN: Delving into high quality object detection,” CVPR (2018)
[9] Tian, Zhi, et al. “FCOS: Fully Convolutional One-Stage Object Detection.” ICCV (2019)
[10] Carion, N., et al. “End-to-End Object Detection with Transformers.” CoRR in: arXiv preprint arXiv:2005.12872 (2020)
Project co-financed from European Union funds under the European Regional Development Funds as part of the Smart Growth Operational Programme.
Project implemented as part of the National Centre for Research and Development: Fast Track.