Introduction
Counting objects in images is one of the fundamental tasks in computer vision. It has a lot of applications, in particular in:
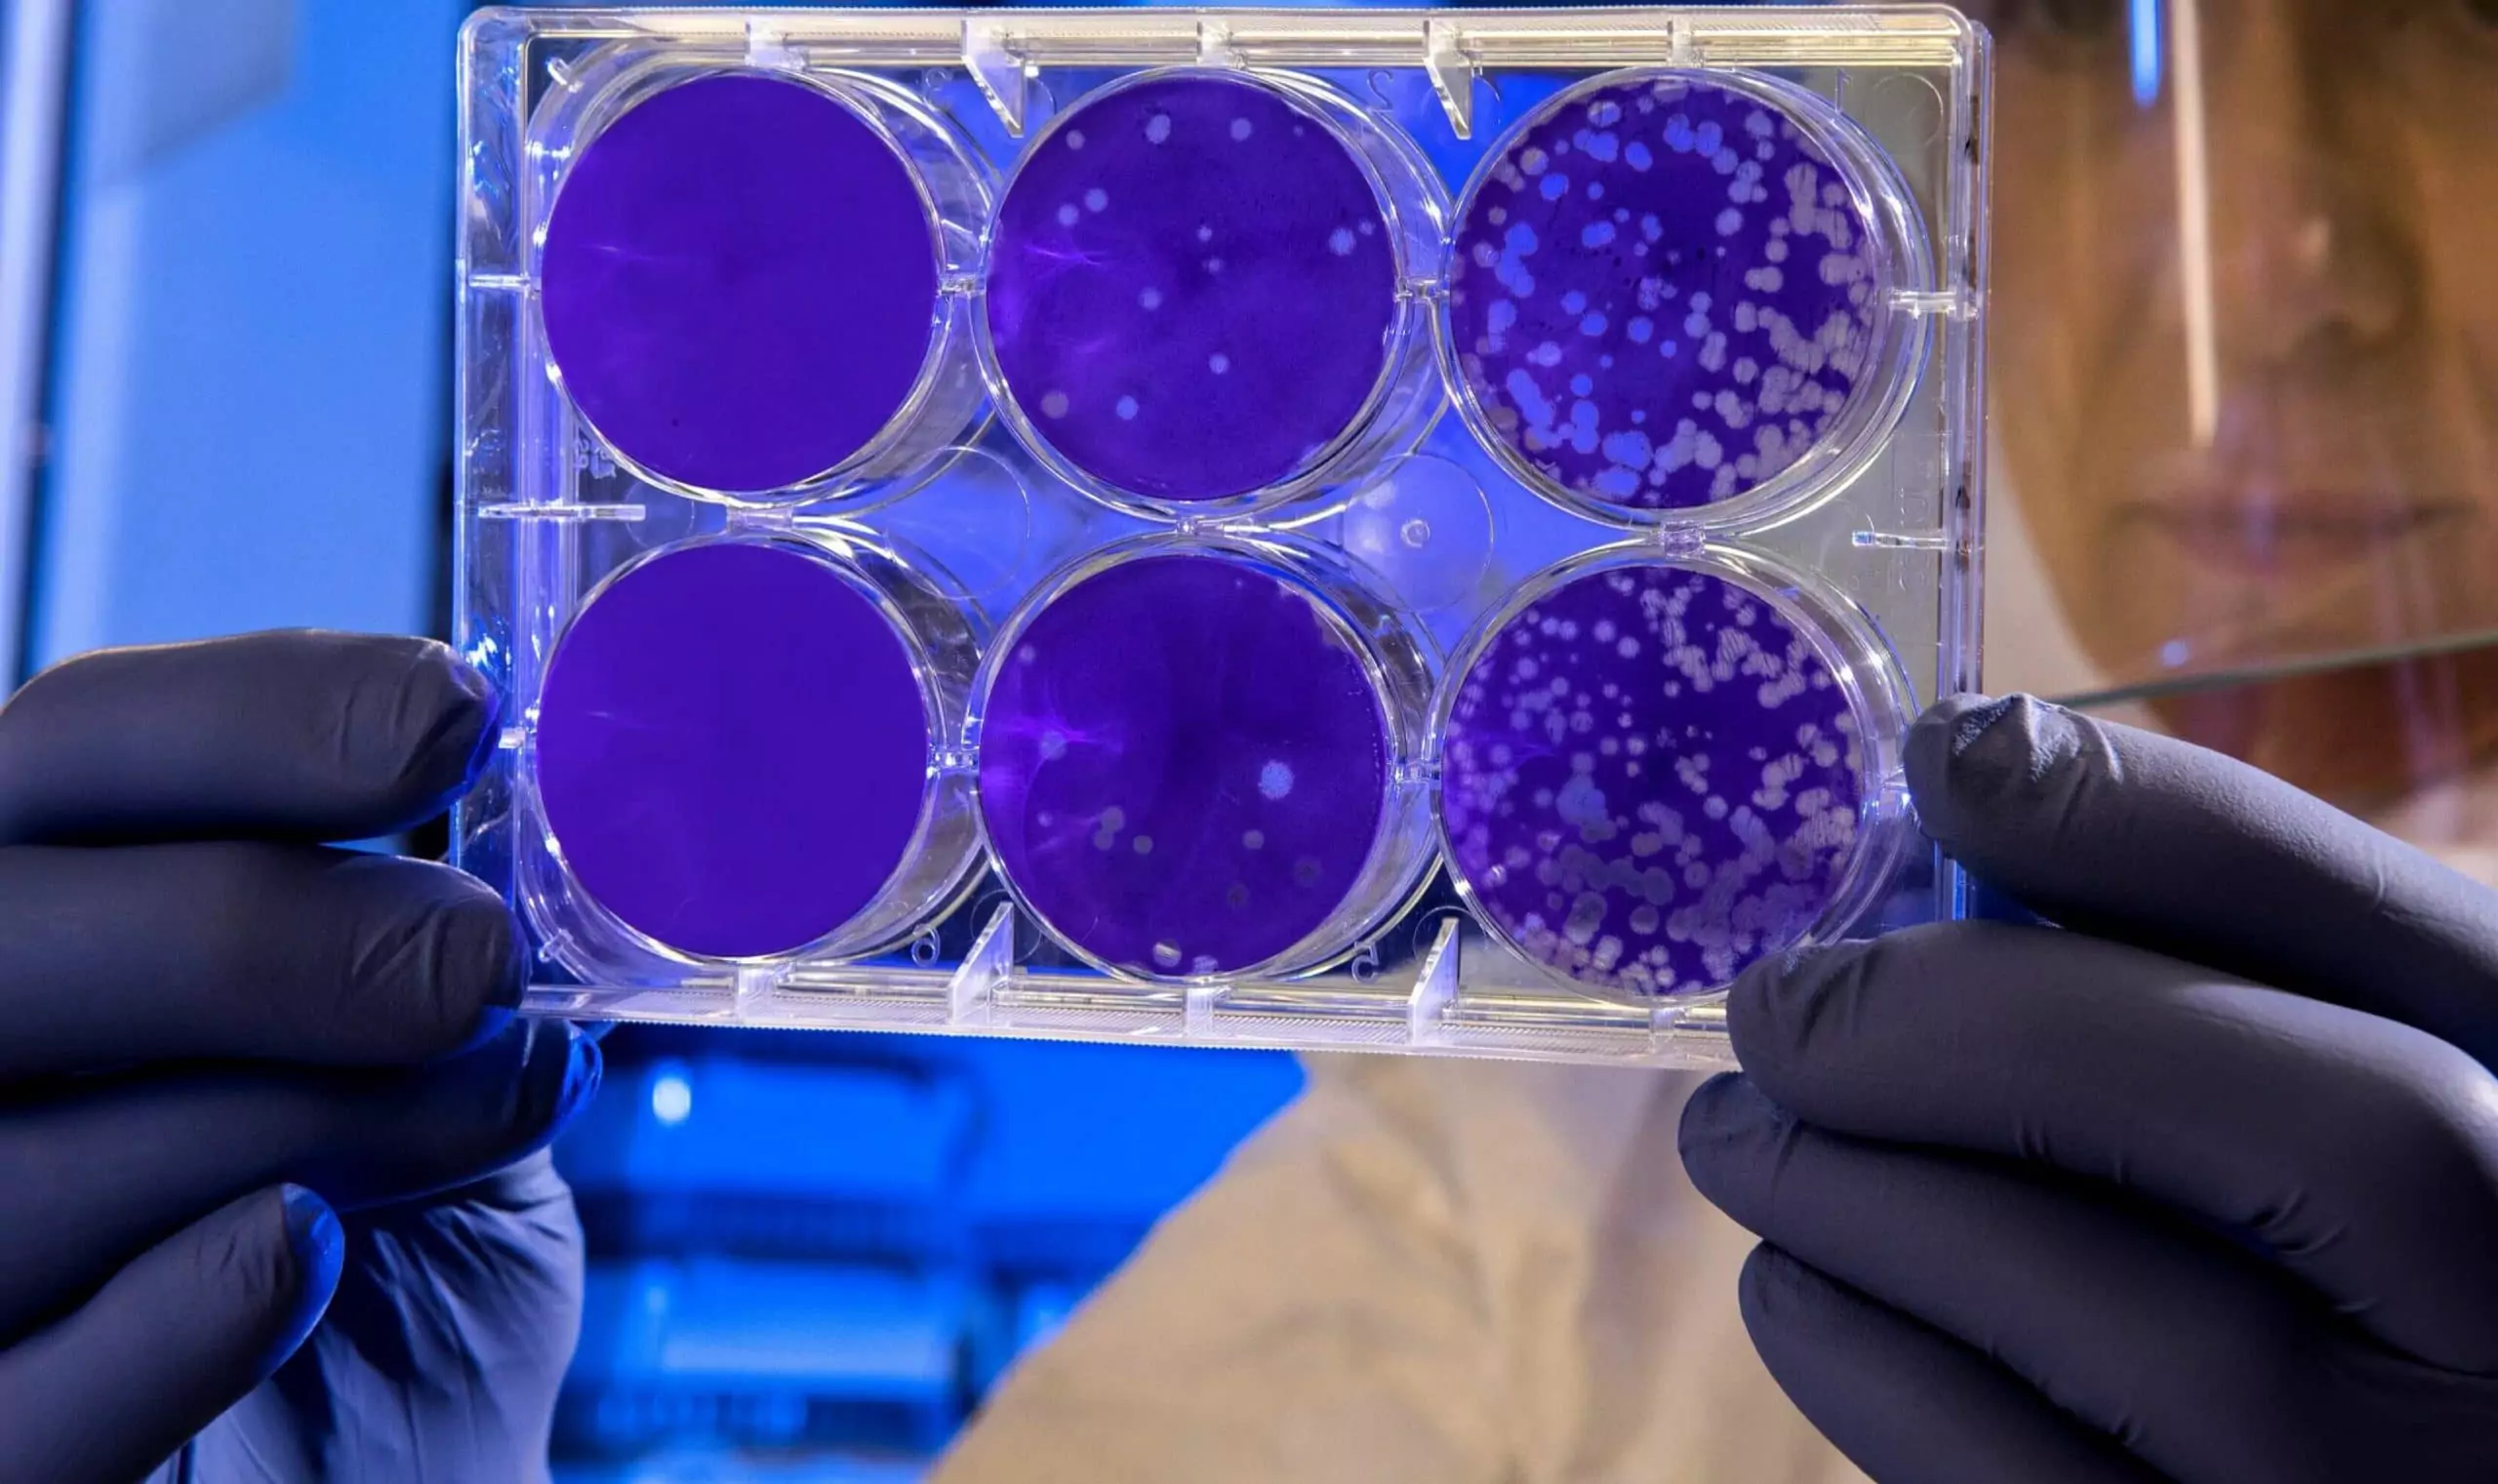
- microbiology (e.g. counting bacterial colonies in a Petri dish);
- surveillance (e.g. counting people);
- agriculture (e.g. counting fruits or vegetables);
- medicine (e.g. counting tumor cells in histopathological images);
- wildlife conservation (e.g. counting animals).
The task of counting objects is relatively easy for us, people, but it can be challenging for a computer vision algorithm, especially when different instances of an object vary significantly in terms of shape, color, texture or size. If a problem is complex from an algorithmic point of view but simple from a human point of view, machine learning methods can be an answer.
Currently, deep learning (DL) methods provide the state-of-the-art performance in digital image processing. However, they require collecting a lot of annotated data, which is usually time consuming and prone to labelling errors.
The common way to count objects using DL is to first detect them using convolutional neural networks, like e.g. GCNet [1], and then count all found instances. It is effective but requires bounding box annotations, like presented in Fig. 1a, which are hard to obtain.

To overcome this issue, alternative approaches leverage point-like annotations of objects positions (see Fig. 1b), which are much cheaper to collect.

In this article we describe our studies on counting objects in images with fully convolutional networks (FCN), trained on data with point-like annotations. In the next sections details on a model we used are presented together with the implementation, considered datasets, and results we obtained.
Method
We decided to start with the approach described in [7]. The main idea is to count objects indirectly by estimating a density map. The first step is to prepare training samples, so that for every image there is a corresponding density map. Let’s consider an example shown in Fig. 2.


The image presented in Fig. 2a is annotated with points in the positions of pedestrians heads (Fig. 2b). A density map is obtained by applying a convolution with a Gaussian kernel (and normalized so that integrating it gives the number of objects). The density map for the example above is presented in Fig. 3.

Now, the goal is to train a fully convolutional network to map an image to a density map, which can be later integrated to get the number of objects. So far, we have considered two FCN architectures: U-Net [8] and Fully Convolutional Regression Network (FCRN) [7].
U-Net
U-Net is a widely used FCN for image segmentation, very often applied to biomedical data. It has autoencoder-like structure (see Fig. 4). An input image is processed by a block of convolutional layers, followed by a pooling layer (downsampling). This procedure is repeated several times on subsequent blocks outputs, which is demonstrated on the left side of Fig. 4. This way the network encodes (and compresses) the key features of an input image. The second part of U-Net is symmetric, but pooling layers are replaced with upsampling, so that an output dimensions match the size of an input image. The information from higher resolution layers in the downsampling part is passed to corresponding layers in the upsampling part, which allows to reuse learned higher level features to decode contracted layers more precisely.

FCRN
Fully Convolutional Regression Network (FCRN) was proposed in [7]. The architecture is very similar to U-Net. The main difference is that the information from higher resolution layers from downsampling part is not passed directly to the corresponding layers in upsampling part. In the paper two networks are proposed: FCRN-A and FCRN-B, which differ in downsampling intensity. While FCRN-A perform pooling every convolutional layer, FCRN-B does that every second layer.

Implementation
Our implementation can be found in our public repository. It is based on the code from Weidi Xi’s GitHub, but PyTorch is used instead of Keras. Please feel free to use it for your research on objects counting in images.
Currently, U-Net and FCNR-A are implemented. They both use three downsampling and three upsampling convolutional blocks with fixed filter size 3×3. By default there are two convolutional layers in each block for U-Net, and one for FCNR-A. For U-Net we keep constant number of filters for all convolutional layers, and for FCRN-A we increase this number every subsequent layer to compensate for the loss of higher resolution information during pooling (which is not passed directly as in the case of U-Net).
Data
We considered three datasets in our study. They all are annotated with point-like objects positions, so we could use them directly to generate density maps for all images and test the method described above. We preprocess them to a common format and store in HDF5 flies before the training.
Fluorescent cells dataset
Fluorescent cells (FC) dataset is generated by Visual Geometry Group (VGG) with a computational framework from [9], which can simulate fluorescence microscope images with bacterial cells. It can be downloaded from VGG website. An example image along with generated density map is presented on Fig. 5

UCSD pedestrian dataset
UCSD dataset [10] contains videos of pedestrians recorded on walkways in the University of California San Diego campus. It is widely used for various problems, such as counting, motion segmentation, and analysis of pedestrians behaviour. It can be downloaded from Statistical Visual Computing Lab website. An example image along with generated density map is presented on Fig. 6.

Mall dataset
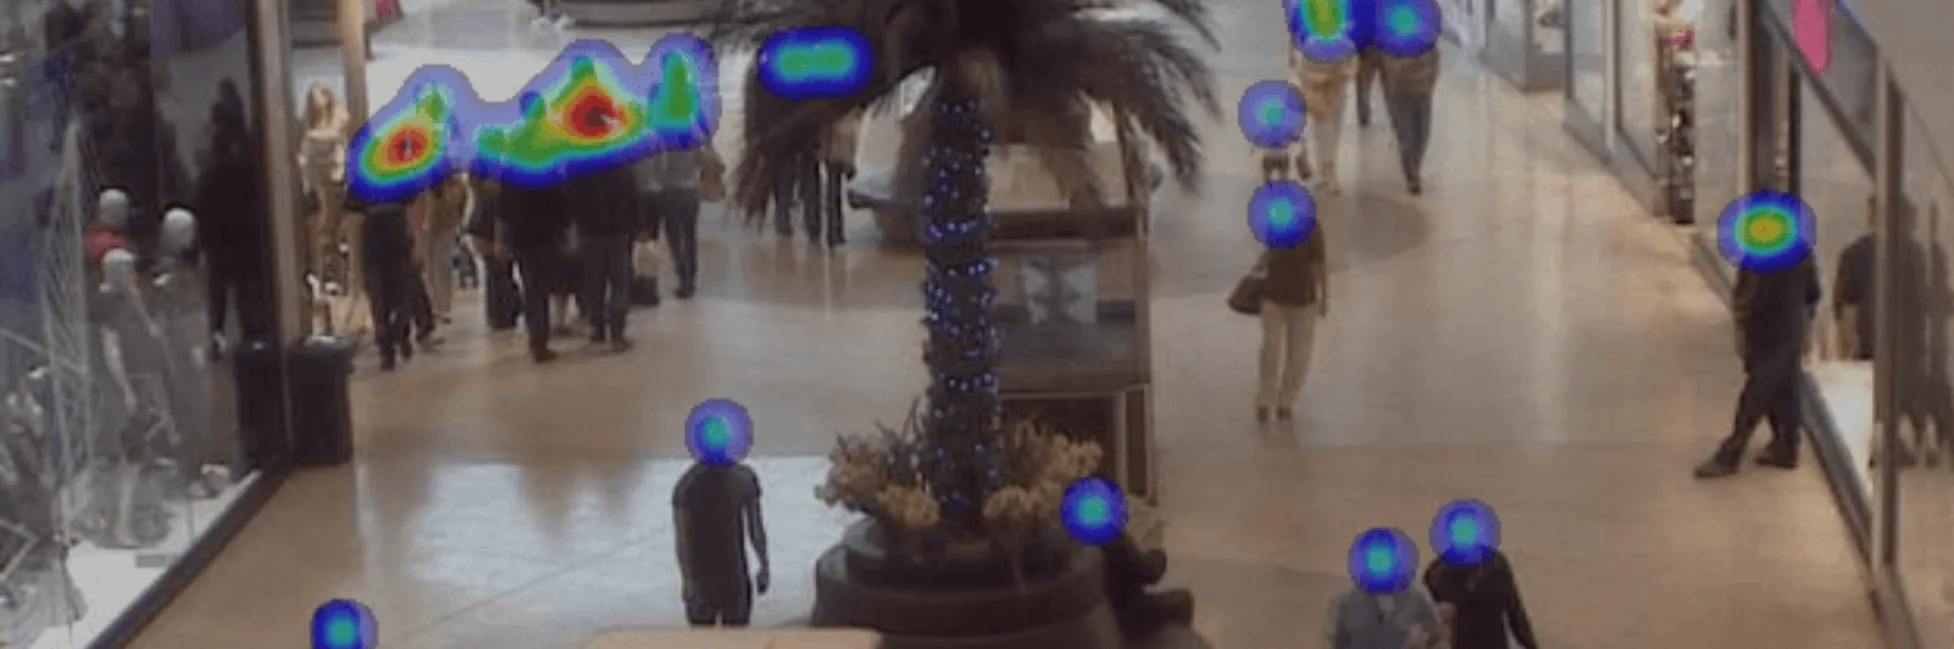
Mall dataset [3-6] was created for crowd counting and profiling. It contains a video recorded by a publicly available webcam. Every frame is annotated with head positions of every pedestrian. An example image along with generated density map is presented on Fig. 3.
The method of counting objects in images by integrating an estimated density map has been already applied to both fluorescent cells and UCSD datasets [11]. We chose mall dataset to be our test dataset for the method.
Results
As stated above, two models were tested, namely U-Net and FCRN. Using U-Net we were able to achieve more accurate results so below we present our findings obtained with this architecture.
In the table below the summary of our results is presented for each dataset with minimum and maximum numbers of objects in validation sets and the mean absolute error (MAE) we obtained.
We used standard definition for MAE:

where ti is true and pi is predicted number of objects for i-th sample.
| Dataset | Min. #objects | Max. #objects | MAE |
| Fluorescent cells | 74 | 317 | 1.89 |
| UCSD | 20 | 47 | 2.27 |
| Mall | 20 | 48 | 2.86 |
The scatter plots for true (ti) vs predicted (pi) number of objects for each validation sample are presented in Figs. 7-9. As expected, the model handles well relatively simple fluorescent cells dataset despite high number of objects in single image. However, there is much higher deviation when counting pedestrians. This could be happening due to the fact that it is difficult even for human labeller to decide whether person standing behind a plant or just barely visible from behind corner should be counted.
This is just the beginning of our research on object counting. We are looking forward to conduct more experiments including trying out different architectures and methods.


References
- Cao, Yue, Jiarui Xu, Stephen Lin, Fangyun Wei, and Han Hu. “GCNet: Non-local Networks Meet Squeeze-Excitation Networks and Beyond.” arXiv preprint arXiv:1904.11492(2019).
- Lin, Tsung-Yi, Michael Maire, Serge Belongie, James Hays, Pietro Perona, Deva Ramanan, Piotr Dollár, and C. Lawrence Zitnick. “Microsoft coco: Common objects in context.” In European conference on computer vision, pp. 740-755. Springer, Cham, 2014.
- Change Loy, Chen, Shaogang Gong, and Tao Xiang. “From semi-supervised to transfer counting of crowds.” In Proceedings of the IEEE International Conference on Computer Vision, pp. 2256-2263. 2013.
- Chen, Ke, Shaogang Gong, Tao Xiang, and Chen Change Loy. “Cumulative attribute space for age and crowd density estimation.” In Proceedings of the IEEE conference on computer vision and pattern recognition, pp. 2467-2474. 2013.
- Loy, Chen Change, Ke Chen, Shaogang Gong, and Tao Xiang. “Crowd counting and profiling: Methodology and evaluation.” In Modeling, simulation and visual analysis of crowds, pp. 347-382. Springer, New York, NY, 2013.
- Chen, Ke, Chen Change Loy, Shaogang Gong, and Tony Xiang. “Feature mining for localised crowd counting.” In BMVC, vol. 1, no. 2, p. 3. 2012.
- Weidi, Xie, J. Alison Noble, and Andrew Zisserman. “Microscopy cell counting with fully convolutional regression networks.” In 1st Deep Learning Workshop, Medical Image Computing and Computer-Assisted Intervention (MICCAI). 2015.
- Ronneberger, Olaf, Philipp Fischer, and Thomas Brox. “U-net: Convolutional networks for biomedical image segmentation.” In International Conference on Medical image computing and computer-assisted intervention, pp. 234-241. Springer, Cham, 2015.
- Lehmussola, Antti, Pekka Ruusuvuori, Jyrki Selinummi, Heikki Huttunen, and Olli Yli-Harja. “Computational framework for simulating fluorescence microscope images with cell populations.” IEEE transactions on medical imaging 26, no. 7 (2007): 1010-1016.
- Chan, Antoni B., Zhang-Sheng John Liang, and Nuno Vasconcelos. “Privacy preserving crowd monitoring: Counting people without people models or tracking.” In 2008 IEEE Conference on Computer Vision and Pattern Recognition, pp. 1-7. IEEE, 2008.
- Lempitsky, Victor, and Andrew Zisserman. “Learning to count objects in images.” In Advances in neural information processing systems, pp. 1324-1332. 2010.
Project co-financed from European Union funds under the European Regional Development Funds as part of the Smart Growth Operational Programme.
Project implemented as part of the National Centre for Research and Development: Fast Track.